

Do you know you can deploy Helm charts as any other Terraform resources? It's possible with the official Helm provider. Learn by doing in this Terraform tutorial!
Today, we will see how to deploy software components with Helm. This will allow you to manage applications on top of Kubernetes in the form of code. You will be able to use Terraform end-to-end in your cloud-native infrastructure.
This Terraform tutorial focuses on the following point:
- A quick review of what Terraform and Helm are.
- Presentation of the official Helm provider
- Learn by doing – deploy a modern monitoring infrastructure with Prometheus and Grafana
Ready to go? Deploy on top of Kubernetes with Helm and Terraform too!
What Is Terraform?
Terraform is a well-known tool in the DevOps ecosystem. It allows you to describe your entire infrastructure in code. This process is called infrastructure as code (IaC).
Terraform keeps also track of the status of your infrastructure in a state file. This file allows Terraform to compare the existing infrastructure with your code. Knowing that Terraform decides which resources create/update/delete for synchronization.
What Is Helm?
Helm is a package management tool to deploy applications in Kubernetes clusters. The YUM and APT commands are present in Linux distributions manages also packages. Helm makes the same but for software on Kubernetes. In Helm terminology, a package is – a chart.
Helm charts help you to define, install and update Kubernetes applications. We won't inspect all the information about Helm here.
But, I invite you to consult this Helm tutorial to be more familiar with it:
The Terraform Helm Provider
Terraform providers allow users to manage various external APIs: cloud providers, databases, and services. This diagram shows how providers interact with the Terraform core and a Target API:
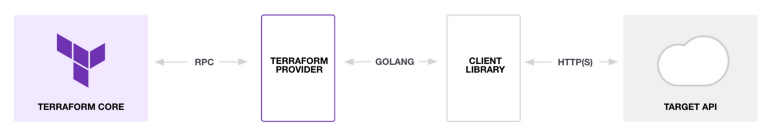
Terraform providers use a Golang client library to communicate. On your side, you have to declare the provider in the Terraform code. Then, you will be able to define resources and fetch distant data.
Hashicorp, the company maintaining Terraform, distributes a provider for Helm. We will use the Helm provider to deploy Helm charts in the next of this article. This provider needs Terraform and Helm binaries installed on your machine to work.
Installing Terraform
$ brew install terraformNot on working on Mac? Check out Terraform downloads
Installing Helm
$ brew install helmNot on working on Mac? Check out Helm downloads
Declaring the Helm provider
You need also to provide proper credentials to connect to the Kubernetes cluster. Many choices are possible. The easiest way is to specify the kubeconfig path:
provider "helm" {
  kubernetes {
    config_path = "~/.kube/config"
  }
}
Deploying The Monitoring Infrastructure With Helm+Terraform
Retrieve the full code of this tutorial in this GitHub repository:
 guivin
Terraform variables
Terraform variables are useful to avoid repeating values:
variable "kube_config" {
  type    = string
  default = "~/.kube/config"
}

variable "namespace" {
  type    = string
  default = "monitoring"
}kube_configis the path to the kubeconfig file. It will be used to connect to the Kubernetes cluster.namespaceis the logical place where Grafana and Prometheus will be deployed with Helm.
Kubernetes & Helm providers
We will manage Kubernetes resources and Helm with Terraform. We declare the Kubernetes provider and Helm provider to go ahead:
provider "helm" {
  # Several Kubernetes authentication methods are possible: https://registry.terraform.io/providers/hashicorp/kubernetes/latest/docs#authentication
  kubernetes {
    config_path = pathexpand(var.kube_config)
  }
}

provider "kubernetes" {
  config_path = pathexpand(var.kube_config)
}Kubernetes namespace
Namespaces in Kubernetes are logical isolation for deployment. We create a monitoring namespace for our new monitoring components:
# Creating namespace with the Kubernetes provider is better than auto-creation in the helm_release.
# You can reuse the namespace and customize it with quotas and labels.
resource "kubernetes_namespace" "monitoring" {
  metadata {
    name = var.namespace
  }
}Prometheus Helm release
helm_release is a Terraform resource from the Helm provider. It allows you to release a Helm chart and customize it with Terraform. You can override the default settings from the original values.yaml with the set blocks:
resource "helm_release" "prometheus" {
  chart      = "prometheus"
  name       = "prometheus"
  namespace  = var.namespace
  repository = "https://prometheus-community.github.io/helm-charts"
  version    = "15.5.3"

  set {
    name  = "podSecurityPolicy.enabled"
    value = true
  }

  set {
    name  = "server.persistentVolume.enabled"
    value = false
  }

  # You can provide a map of value using yamlencode. Don't forget to escape the last element after point in the name
  set {
    name = "server\\.resources"
    value = yamlencode({
      limits = {
        cpu    = "200m"
        memory = "50Mi"
      }
      requests = {
        cpu    = "100m"
        memory = "30Mi"
      }
    })
  }
}Grafana Helm release
Values can be passed to the helm_release resource through files:
resource "kubernetes_secret" "grafana" {
  metadata {
    name      = "grafana"
    namespace = var.namespace
  }

  data = {
    admin-user     = "admin"
    admin-password = random_password.grafana.result
  }
}

resource "random_password" "grafana" {
  length = 24
}

resource "helm_release" "grafana" {
  chart      = "grafana"
  name       = "grafana"
  repository = "https://grafana.github.io/helm-charts"
  namespace  = var.namespace
  version    = "6.24.1"

  values = [
    templatefile("${path.module}/templates/grafana-values.yaml", {
      admin_existing_secret = kubernetes_secret.grafana.metadata[0].name
      admin_user_key        = "admin-user"
      admin_password_key    = "admin-password"
      prometheus_svc        = "${helm_release.prometheus.name}-server"
      replicas              = 1
    })
  ]
}The above snippet defines a Kubernetes Secret for accessing Grafana. The credential is a random password generated by Terraform. The values.yaml is templated by Terraform and passed to the helm_release.grafana.
Accessing The Prometheus Server
Create the port-forward session to the Prometheus server:
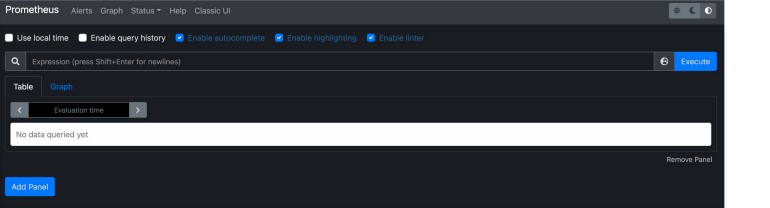
$ kubectl port-forward --namespace monitoring svc/prometheus-server 8080:80Go to http://localhost:8080 to access the Prometheus UI:
Accessing The Grafana UI
Create the port-forward session to Grafana:
$ kubectl port-forward --namespace monitoring svc/grafana 3000:80Get the Grafana admin username:
$ kubectl get secret --namespace monitoring grafana -o jsonpath="{.data.admin-user}" | base64 --decode Get the Grafana admin password:
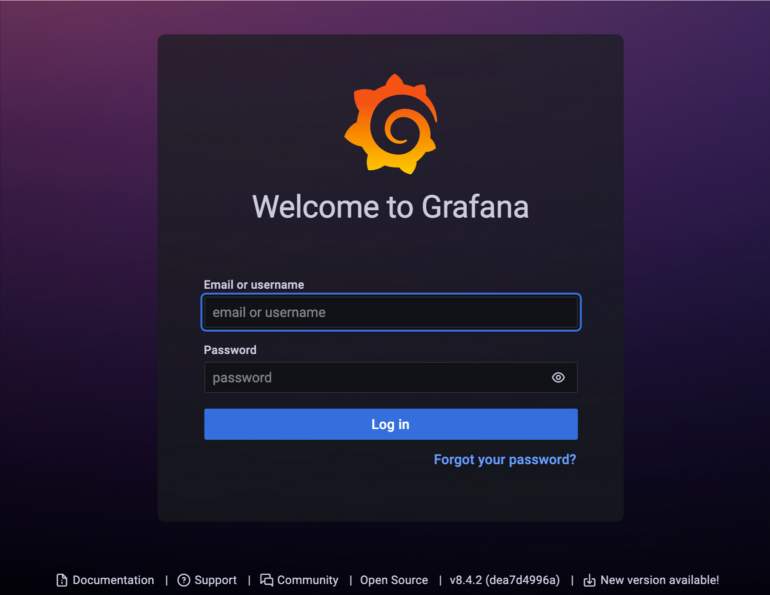
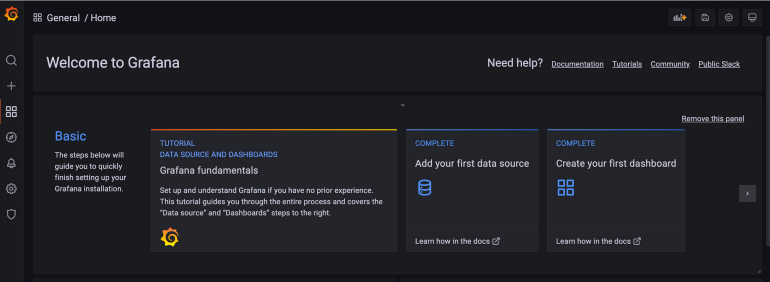
$ kubectl get secret --namespace monitoring grafana -o jsonpath="{.data.admin-password}" | base64 --decodeGo to http://localhost:3000 to access the Grafana UI. Reuse the previous credentials to log in:
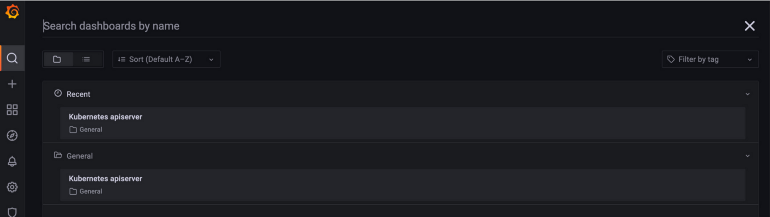
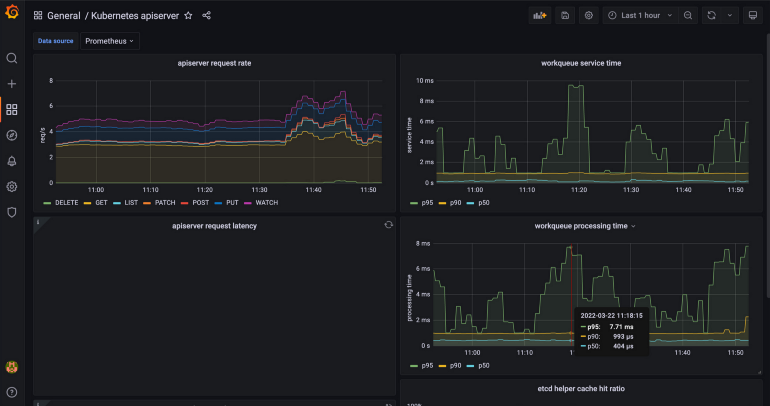
The Kubernetes API Server dashboard is provisioned in the values-grafana.yaml file. The dashboard is visible in the Grafana UI:
Conclusion
We have discovered in this tutorial how to use Terraform and Helm together with the official Helm provider. The Helm chart is called through the helm_release resource. It is possible to customize the deployment values using set block or templating the values.yaml.
The example here deploys complete monitoring with Prometheus and Grafana. stack:
- Prometheus collects the cluster metrics
- Grafana allows us to visualize metrics over beautiful dashboards
Coupling Terraform with Helm is great because you can orchestrate the Helm chart deployment and dependencies with your all infrastructure components. Helm charts are finally considered as any other type of resource.