
Monitoring is a key pillar of DevOps best practices to ensure performance and health. In a distributed environment such as Kubernetes and microservices, it is even more true. This tutorial shows you how to build effectively a modern monitoring stack with Prometheus & Grafana on Kubernetes.
Monitoring is a key pillar of DevOps best practices. This gives vital information on the performance and health of a platform. In a distributed environment such as Kubernetes and microservices, it is even more true.
One of the great strengths of Kubernetes is the ability to scale your services and applications. When you reach thousand of applications, monitoring them manually or using scripts is not viable. You need to adopt a monitoring system that scales too! That's where Prometheus and Grafana come into the scene.
Prometheus will collect, store and allow you to leverage your platform metrics. On the other hand, Grafana will plug into Prometheus and allow you to create beautiful dashboards and charts.
Today, we'll go over what Prometheus is and the best way to deploy it on Kubernetes: using the operator. We'll see how to set up a monitoring platform with Prometheus and Grafana.
This tutorial will give you a good starting point with observability and go further!
Prometheus
Timeline
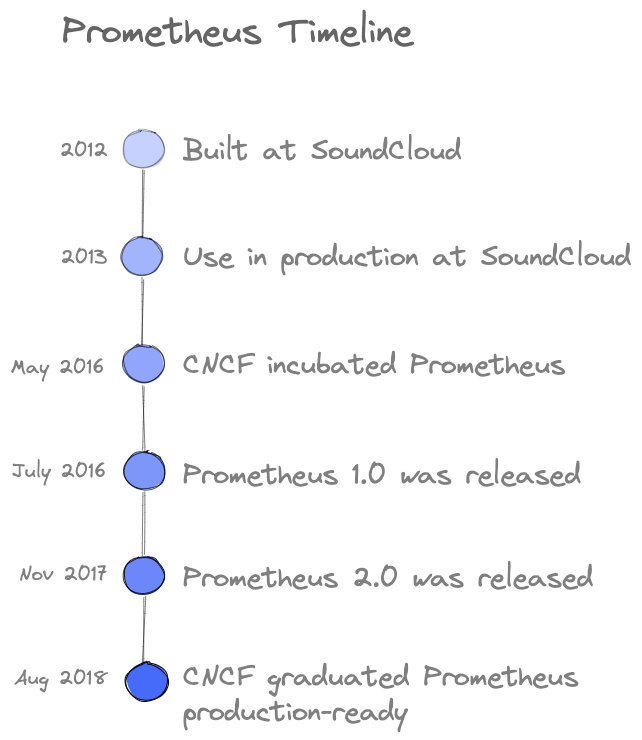
Prometheus is a free and open-source application for event monitoring and alerting built at SoundCloud in 2012. Then many companies and organizations adopted it and contributed. In 2016, the Cloud Native Computing Foundation (CNCF) incubated the Prometheus project just after Kubernetes.
The following timeline shows the evolution of the Prometheus project:
Concepts
Prometheus is considered as the default monitoring solution for Kubernetes and was inspired by Borgman from Google. It collects metrics from applications and infrastructure using the HTTP pull requests. Targets are discovered via service discovery or static configuration. Pushing time series is also supported via an intermediary gateway.
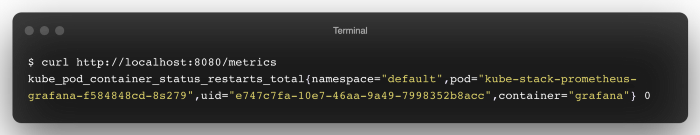
Metrics exposed by a Prometheus target has the following format: <metric name>{<label name>=<label value>, ...}
Prometheus records real-time metrics in a time-series database (TSDB) – which brings dimensional data models, operational simplicity, and scalable data collection. It provides PromQL, a flexible query language to leverage this dimensionality.
Architecture
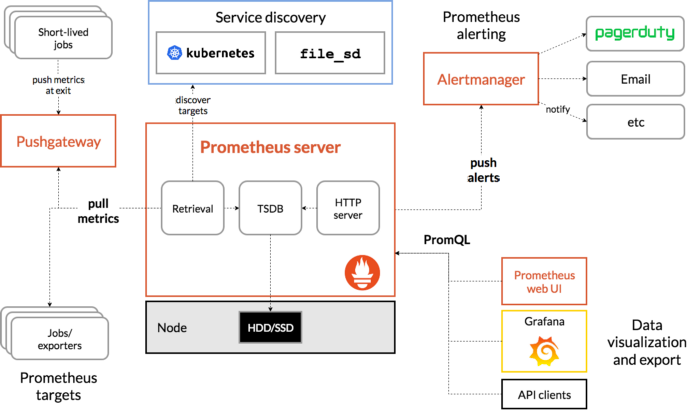
The architecture diagram shows Prometheus is a multi-component monitoring system. The following pieces are integrated into the Prometheus deployment:
- Prometheus server scraping and stores time-series data. It also provides a user interface to query the metrics.
- Client libraries for instrumenting application code.
- Pushgateway supports metrics collection from short-lived jobs
- Exporters for services that do not instrument Prometheus metrics directly.
- Alertmanager handles real-time alerts based on triggers
Why Choose The Prometheus Operator?
Kubernetes provides a lot of objects to deploy your applications: Pod, Deployment, Service, Ingress, etc... These are native resources and as they are generic they do not behave like the final application. Kubernetes allows you to create custom resources through Custom Resource Definition (CRD).
CRD objects implement the behavior of the final application. This allows better maintainability and reduces the deployment effort. When using the Prometheus Operator, each component of the architecture comes from a CRD. This makes the Prometheus setup more straightforward than a classical installation.
In classical Prometheus installation, adding new metric endpoints requires an update of the server configuration. This allows registering a new endpoint as a target to collect metrics. The Prometheus Operator uses Monitor objects (PodMonitor, ServiceMonitor) to discover dynamically endpoints and scrape metrics.
Deploying Prometheus With The Operator
kube-prometheus-stack is a collection of Kubernetes manifests, Grafana dashboards, and Prometheus rules. It provides easy-to-operate end-to-end Kubernetes cluster monitoring with Prometheus using the Operator.
 prometheus-community
This collection is available and deployable through a Helm chart. You can deploy in a single command line the monitoring stack – New to Helm? Have a look at this tutorial to get started!
Installing Helm
$ brew install helmCreating the dedicated monitoring namespace
In Kubernetes, namespaces provide a mechanism for isolating groups of resources within a single cluster. We create a namespace named monitoring to prepare the new deployment:
$ kubectl create namespace monitoringInstalling kube-prometheus-stack with Helm
Add the Prometheus chart repository and update the local cache:
$ helm repo add prometheus-community https://prometheus-community.github.io/helm-charts
$ helm repo update
Deploy the kube-stack-prometheus chart in the namespace monitoring with Helm:
$ helm upgrade --namespace monitoring --install kube-stack-prometheus prometheus-community/kube-prometheus-stack --set prometheus-node-exporter.hostRootFsMount.enabled=falsehostRootFsMount.enabled is set to false to work on Docker Desktop on Mac
CRDs are now installed in the namespace. You can verify with the following kubectl command:
$ kubectl get -n monitoring crds
NAME                                        CREATED AT
alertmanagerconfigs.monitoring.coreos.com   2022-03-15T10:54:41Z
alertmanagers.monitoring.coreos.com         2022-03-15T10:54:42Z
podmonitors.monitoring.coreos.com           2022-03-15T10:54:42Z
probes.monitoring.coreos.com                2022-03-15T10:54:42Z
prometheuses.monitoring.coreos.com          2022-03-15T10:54:42Z
prometheusrules.monitoring.coreos.com       2022-03-15T10:54:42Z
servicemonitors.monitoring.coreos.com       2022-03-15T10:54:42Z
thanosrulers.monitoring.coreos.com          2022-03-15T10:54:42Z
Here is what we have running now in the namespace:
$ kubectl get pods -n monitoring
NAME                                                       READY   STATUS    RESTARTS   AGE
alertmanager-kube-stack-prometheus-kube-alertmanager-0     2/2     Running   0          2m36s
kube-stack-prometheus-grafana-6994bd6c69-h6s9z             3/3     Running   0          13h
kube-stack-prometheus-kube-operator-86667b5cdf-cqndt       1/1     Running   0          13h
kube-stack-prometheus-kube-state-metrics-fc9878699-dpgh6   1/1     Running   0          13h
kube-stack-prometheus-prometheus-node-exporter-vrjsl       1/1     Running   0          13h
prometheus-kube-stack-prometheus-kube-prometheus-0         2/2     Running   0          13h
The chart has installed Prometheus components and Operator, Grafana – and the following exporters:
- prometheus-node-exporter exposes hardware and OS metrics
- kube-state-metrics listens to the Kubernetes API server and generates metrics about the state of the objects
Our monitoring stack with Prometheus and Grafana is up and ready!
Connecting To Prometheus Web Interface
The Prometheus web UI is accessible through port-forward with this command:
$ kubectl port-forward --namespace monitoring svc/kube-stack-prometheus-kube-prometheus 9090:9090Opening a browser tab on http://localhost:9090 shows the Prometheus web UI. We can retrieve the metrics collected from exporters:
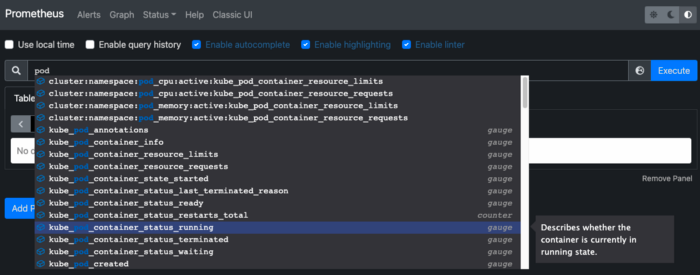
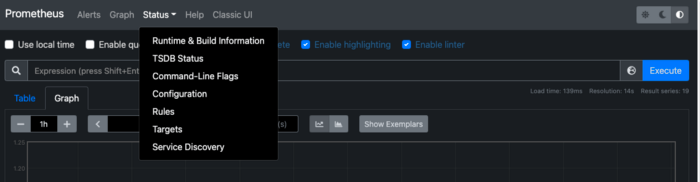
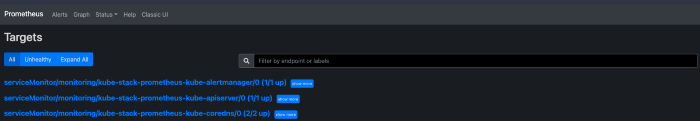
Going to the "Status>Targets" and you can see all the metric endpoints discovered by the Prometheus server:
Connecting To Grafana
The credentials to connect to the Grafana web interface are stored in a Kubernetes Secret and encoded in base64. We retrieve the username/password couple with these two commands:
$ kubectl get secret --namespace monitoring kube-stack-prometheus-grafana -o jsonpath='{.data.admin-user}' | base64 -d
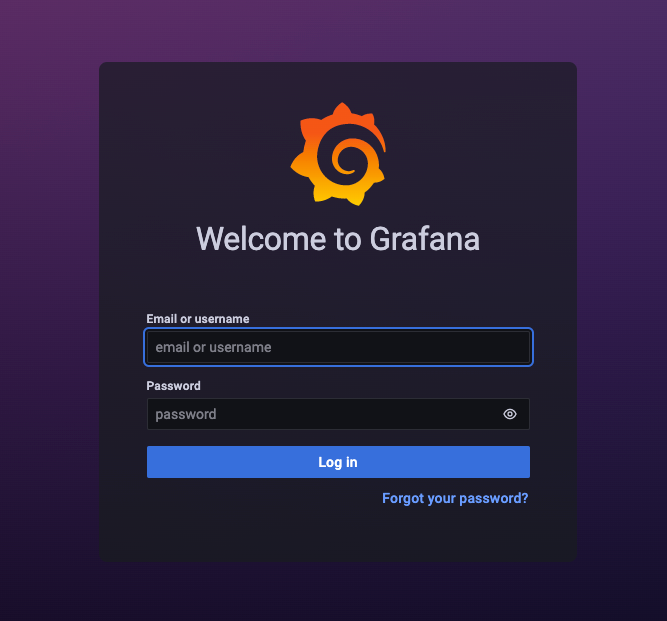
$ kubectl get secret --namespace monitoring kube-stack-prometheus-grafana -o jsonpath='{.data.admin-password}' | base64 -dWe create the port-forward to Grafana with the following command:
$ kubectl port-forward --namespace monitoring svc/kube-stack-prometheus-grafana 8080:80Open your browser and go to http://localhost:8080 and fill in previous credentials:
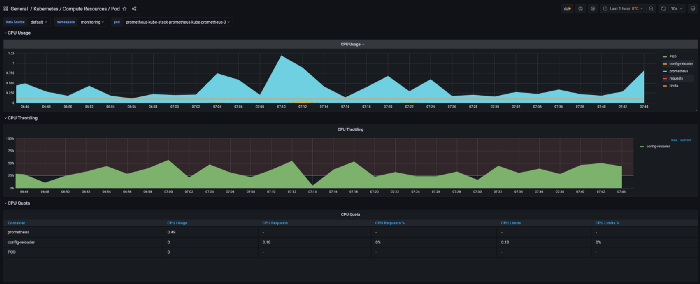
The kube-stack-prometheus deployment has provisioned Grafana dashboards:
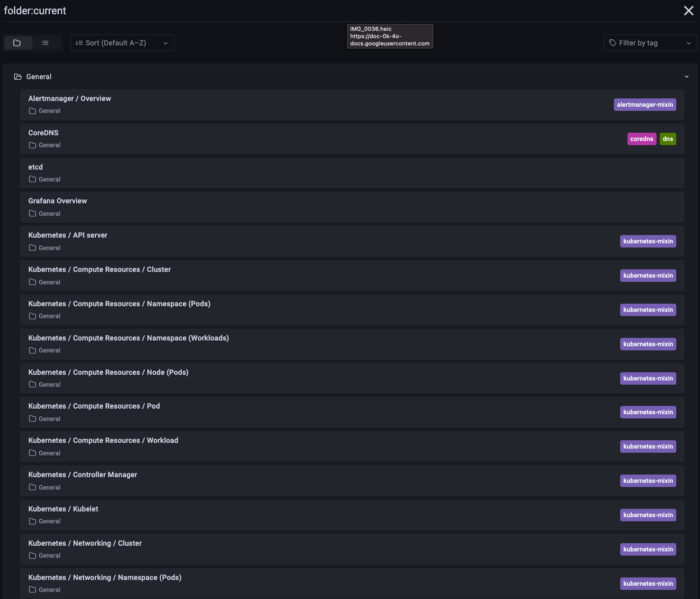
Here we can see one of them showing compute resources of Kubernetes pods: