
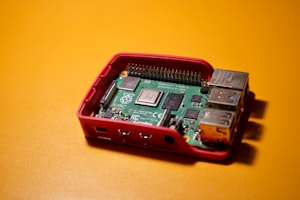
Track your home temperature and humidity with a Raspberry Pi
Prometheus is an open-source project for monitoring and alerting metrics. It relies on a time-series database that is well suited to IoT purposes. In this article, we’ll see how to collect temperature and humidity from a Raspberry Pi. These metrics are collected from a DHT22/AM2302 sensor. We’re going to see how to connect the sensor to the card and confirm data acquisition.
The next step is the implementation of a Prometheus exporter in Golang. An exporter exposes the metrics through an HTTP server with a good format. The Prometheus server calls the exporter to collect and store the metrics. Prometheus is itself written in Golang and our exporter will use the same libraries.
Once metrics are in Prometheus, we configure a beautiful Grafana dashboard.
Sensor Configuration
Presentation
The AM2302 is a wired version of the DHT22 sensor. The datasheet presents the following characteristics :
- Low cost
- 3v to 5v power and I/O
- 2.5 mA max current use during conversion (while requesting data)
- Good for 0–100% humidity readings with 2–5% accuracy
- Good for -40 to 80°C temperature readings with ±0.5°C accuracy
- No more than 0.5 Hz sampling rate (once every 2 seconds)
- Body size 15.1mm x 25mm x 7.7mm
- 4 pins with 0.1" spacing
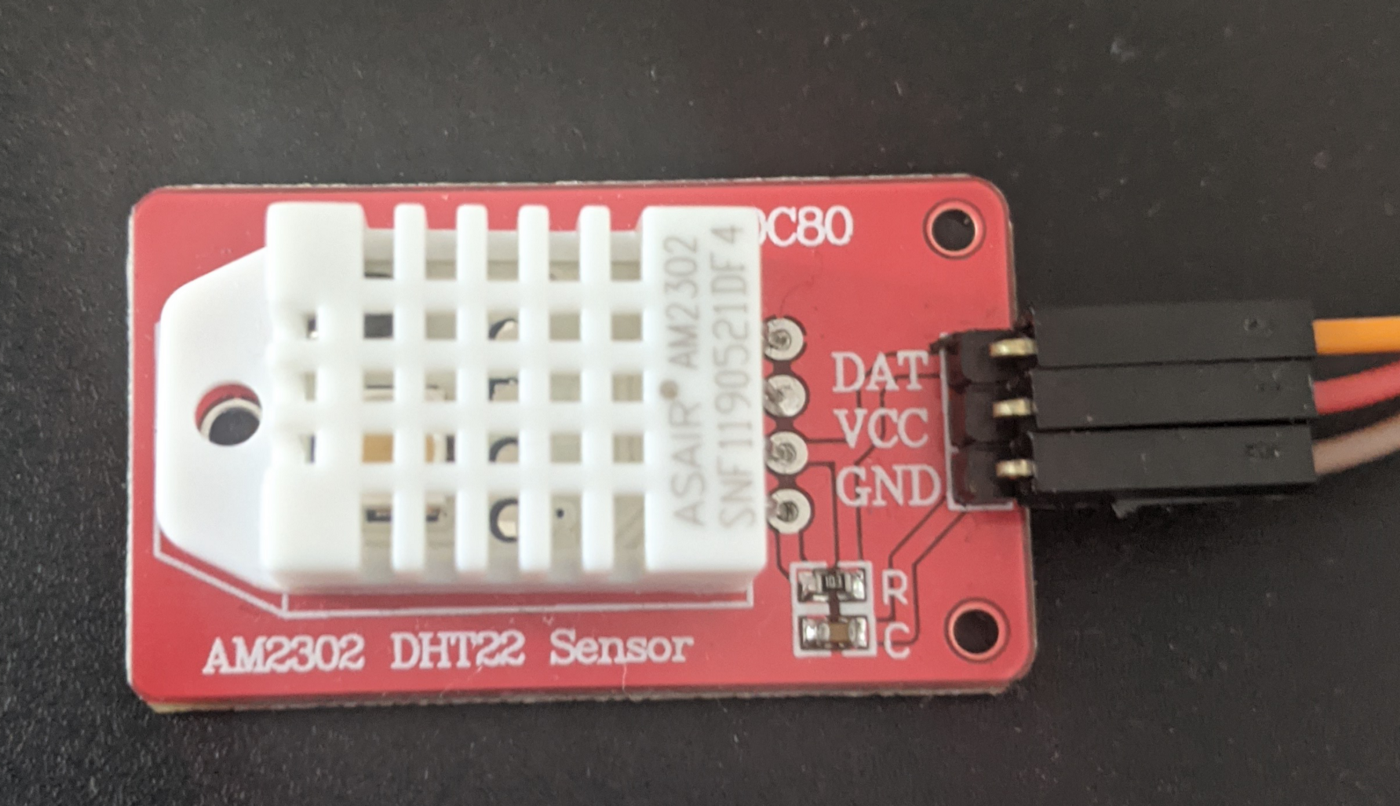
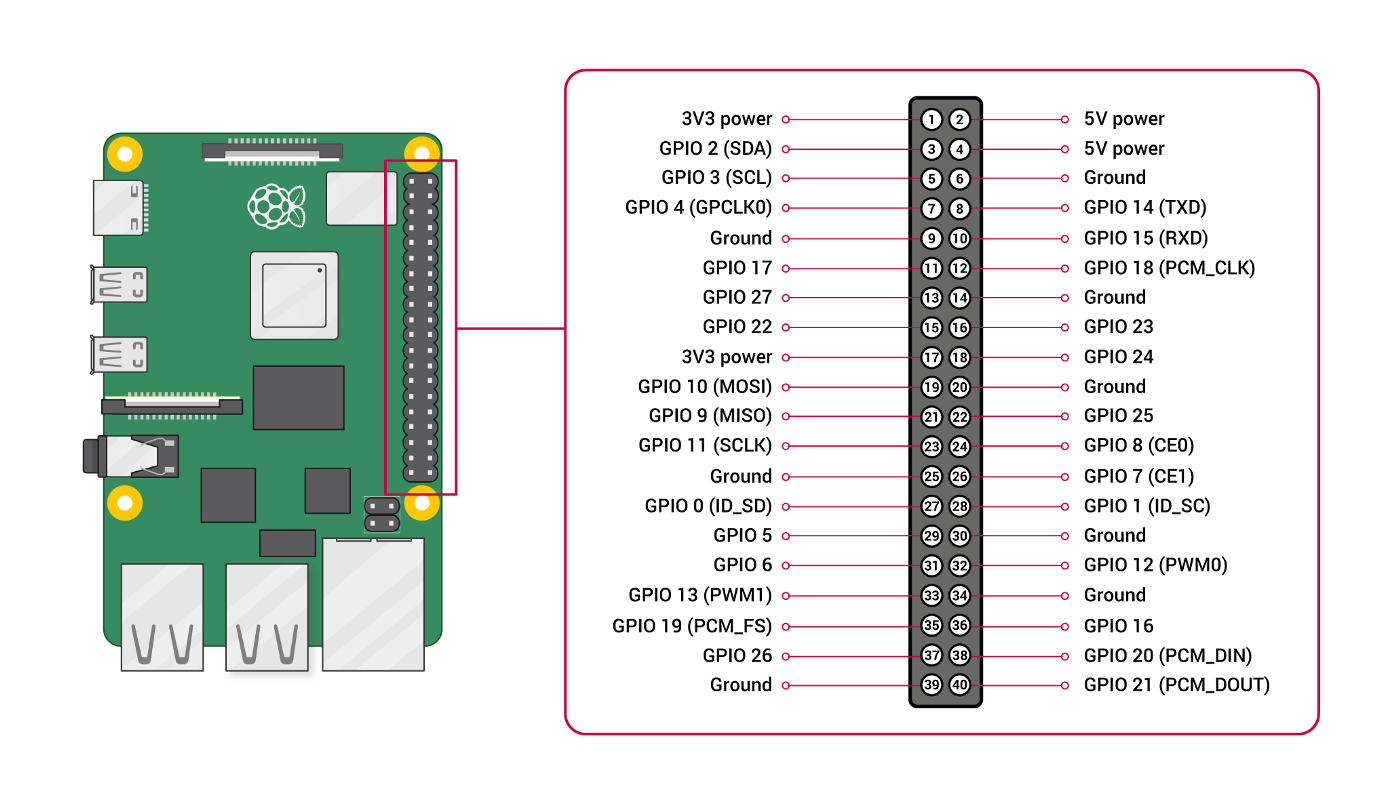
Connection
The sensor is plug and play and it is connecting to the Raspberry Pi as follows :
- DAT on a GPIO pin (GPIO3)
- VCC on an alimentation pin between 3v and 5v (PIN1)
- GCC on a ground pin (PIN6)
Data acquisition
Update the list of available packages and install python3 and pip:
$ sudo apt-get update
$ sudo apt-get install python3 python3-pip
$ python3 -m pip install --upgrade pip
Install the Adafruit-DHT pip package :
$ python3 -m pip install Adafruit-DHT# coding: utf-8
import Adafruit_DHT
if __name__ == '__main__':
sensor = Adafruit_DHT.AM2302
# AM2302 is connected to GPIO2
pin = 2
# Retry up 15 times to get a sensor reading (waiting 2 seconds between each retry)
humidity, temperature = Adafruit_DHT.read_retry(sensor, pin)
# Linux cannot guarantee the timing calls and value could be null. In this case, retry again
if humidity is not None and temperature is not None:
print('Temp={0:0.1f}*C Humidity={1:0.1f}%'.format(temperature, humidity))
else:
print('Failed to get reading. Try again!')Make the script executable and launch it :
$ chmod +x am2302_tester.py
$ python3 am2302_tester.py
Temp=19.2*C  Humidity=55.0%
The humidity and temperature metrics are well collected by the sensor.
The Prometheus Exporter
Configuration
The configuration is a YAML file and has different locations following the priority:
/etc/dht-prometheus-exporter.yml$HOME/dht-prometheus-exporter.yml$PWD/dht-prometheus-exporter.yml
The viper package manages the configuration file and stores values into a struct. The recurrent information is accessible to other parts of the project.
package main

import (
	"fmt"
	"github.com/spf13/viper"
)

type Config struct {
	path            string
	name            string
	gpio            string
	maxRetries      int
	listenPort      int
	defaultLogLevel string
	temperatureUnit string
}

func ReadConfig() *Config {
	/**
	Reads YAML configuration file and create a struct containing the values
	**/
	viper.SetConfigName("dht-prometheus-exporter")
	viper.SetConfigType("yaml")
	viper.AddConfigPath("/etc")
	viper.AddConfigPath("$HOME")
	viper.AddConfigPath(".")
	err := viper.ReadInConfig()

	if err != nil {
		panic(fmt.Sprintf("Error when reading config file: %v", err))
	}

	config := &Config{
		path:            viper.ConfigFileUsed(),
		name:            viper.GetString("name"),
		gpio:            fmt.Sprintf("GPIO%d", viper.GetInt("gpio_pin")),
		maxRetries:      viper.GetInt("max_retries"),
		listenPort:      viper.GetInt("listen_port"),
		defaultLogLevel: viper.GetString("log_level"),
		temperatureUnit: viper.GetString("temperature_unit"),
	}

	return config
}Logging
The logrus package manages the logging and reuses the level defined in the configuration :
package main

import (
	log "github.com/sirupsen/logrus"
	"os"
	"sync"
)

const defaultLogLevel = log.InfoLevel

var (
	once     sync.Once
	instance log.Logger
)

func LogLevel(levelName string) log.Level {
	/**
	Set the log level of logrus following the value supplied in the configuration
	*/
	var logLevel log.Level

	switch levelName {
	case "debug":
		logLevel = log.DebugLevel
	case "info":
		logLevel = log.InfoLevel
	case "warn":
		logLevel = log.WarnLevel
	case "error":
		logLevel = log.ErrorLevel
	case "fatal":
		logLevel = log.FatalLevel
	case "panic":
		logLevel = log.PanicLevel
	default:
		logLevel = defaultLogLevel
	}

	return logLevel
}

func getLogger(config *Config) log.Logger {
	/**
	Singleton to get the same logger instance everywhere
	*/
	once.Do(func() {
		instance = log.Logger{
			Out:   os.Stderr,
			Level: LogLevel(config.defaultLogLevel),
			Formatter: &log.TextFormatter{
				DisableColors: true,
				FullTimestamp: true,
			},
		}
	})

	return instance
}Sensor
The go-dht package interface with the sensor. It has already a function to read data from the gpio pin. A struct contains the collected metrics :
package main

import (
	"fmt"
	"github.com/MichaelS11/go-dht"
)

type Sensor struct {
	config            *Config
	temperatureSymbol string
	client            *dht.DHT
}

const CelsiusSymbol = "C"
const FahrenheitSymbol = "F"

func newSensor(config *Config) *Sensor {
	/**
	Sensor constructor
	*/
	var err error
	var client *dht.DHT
	var temperatureSymbol string

	lg.Info("Initializing the DHT22/AM2302 sensor on the host")
	err = dht.HostInit()
	if err != nil {
		lg.Panic("Failed to initialized DHT22/AM2302 sensor on the host: ", err)
	}

	if config.temperatureUnit == "celsius" {
		client, err = dht.NewDHT(config.gpio, dht.Celsius, "")
		temperatureSymbol = CelsiusSymbol
	} else {
		client, err = dht.NewDHT(config.gpio, dht.Fahrenheit, "")
		temperatureSymbol = FahrenheitSymbol
	}

	if err != nil {
		lg.Panic("Failed to create new DHT client: ", err)
	}

	return &Sensor{
		config:            config,
		temperatureSymbol: temperatureSymbol,
		client:            client,
	}
}

func (s *Sensor) readRetry() (humidity float64, temperature float64, err error) {
	/**
	Reads the sensor data with retry
	*/
	humidity, temperature, err = s.client.ReadRetry(s.config.maxRetries)
	if err != nil {
		lg.Error("Cannot retrieve humidity and temperature from the sensor: ", err)
	}
	lg.Info(fmt.Sprintf("Retrieved humidity=%.2f%%, temperature=%.2f°%s from the sensor",
		humidity, temperature, s.temperatureSymbol))
	return humidity, temperature, err
}Prometheus collector
The Prometheus package provides the collector. It lists the different metrics to collect and expose them. The humidity and temperature metrics are in the same collector. Metrics have labels to give more context :
- dht_name: name of the sensor to be easily identified (in case of multiple sensors)
- hostname
- unit: the temperature unit in Fahrenheit or Celsius
Describe and Collector functions are already implemented in the Prometheus package. We need to redefine them to overload the functions with our metrics:
package main

import (
	"github.com/prometheus/client_golang/prometheus"
	"os"
)

type Collector struct {
	sensor            *Sensor
	temperatureMetric *prometheus.Desc
	humidityMetric    *prometheus.Desc
}

func newCollector(s *Sensor) *Collector {
	lg.Debug("Creating a new prometheus collector for the sensor")
	return &Collector{
		sensor: s,
		temperatureMetric: prometheus.NewDesc("dht_temperature_degree",
			"Temperature degree measured by the sensor",
			[]string{"dht_name", "hostname", "unit"}, nil,
		),
		humidityMetric: prometheus.NewDesc("dht_humidity_percent",
			"Humidity percent measured by the sensor",
			[]string{"dht_name", "hostname"}, nil,
		),
	}
}

func (c *Collector) Describe(ch chan<- *prometheus.Desc) {
	ch <- c.temperatureMetric
	ch <- c.humidityMetric
}

func (c *Collector) Collect(ch chan<- prometheus.Metric) {
	humidity, temperature, _ := c.sensor.readRetry()
	hostname, err := os.Hostname()
	temperatureUnit := c.sensor.config.temperatureUnit
	dhtName := c.sensor.config.name
	if err != nil {
		lg.Error("Failed to get hostname")
	}
	ch <- prometheus.MustNewConstMetric(c.temperatureMetric, prometheus.CounterValue, temperature, dhtName, hostname, temperatureUnit)
	ch <- prometheus.MustNewConstMetric(c.humidityMetric, prometheus.CounterValue, humidity, dhtName, hostname)
}Main
The main file makes the glue between the previous file’s functions. It created the client charged of reading data from the gpio pin. Then it instantiates the collector with this client and registered it. Finally, it configures the promhttp server with the logging and starts it. The metrics are accessible on the /metricspath:
package main

import (
	"fmt"
	"github.com/coreos/go-systemd/daemon"
	"github.com/prometheus/client_golang/prometheus"
	"github.com/prometheus/client_golang/prometheus/promhttp"
	log "github.com/sirupsen/logrus"
	stdlibLog "log"
	"net/http"
)

var lg log.Logger

func main() {
	config := ReadConfig()
	lg = getLogger(config)
	w := lg.Writer()
	defer w.Close()
	sensor := newSensor(config)
	collector := newCollector(sensor)
	lg.Debug("Registering the prometheus collector")
	prometheus.MustRegister(collector)
	http.Handle("/metrics", promhttp.HandlerFor(prometheus.DefaultGatherer, promhttp.HandlerOpts{
		ErrorLog: stdlibLog.New(w, "", 0),
	}))
	lg.Info(fmt.Sprintf("Starting http server on TCP/%d port", config.listenPort))
	lg.Fatal(http.ListenAndServe(fmt.Sprintf(":%d", config.listenPort), nil))
	daemon.SdNotify(false, daemon.SdNotifyReady)

}Once started the binary shows the collected metrics on request :
$ pi@raspberrypi:~/go/src/github.com/guivin/dht-prometheus-exporter $ ./dht-exporter
time="2021-02-17T20:19:20Z" level=info msg="Initializing the DHT22/AM2302 sensor on the host"
time="2021-02-17T20:19:20Z" level=info msg="Starting http server on TCP/8080 port"
time="2021-02-17T20:19:36Z" level=info msg="Retrieved humidity=62.70%, temperature=68.90°F from the sensor"
The request is done on the TCP/8080 port :
# HELP dht_humidity_percent Humidity percent measured by the sensor
# TYPE dht_humidity_percent counter
dht_humidity_percent{dht_name="test",hostname="raspberrypi"} 62.8
# HELP dht_temperature_degree Temperature degree measured by the sensor
# TYPE dht_temperature_degree counter
dht_temperature_degree{dht_name="test",hostname="raspberrypi",unit="fahrenheit"} 68.9
# HELP go_gc_duration_seconds A summary of the GC invocation durations.
# TYPE go_gc_duration_seconds summary
go_gc_duration_seconds{quantile="0"} 0
go_gc_duration_seconds{quantile="0.25"} 0
go_gc_duration_seconds{quantile="0.5"} 0
go_gc_duration_seconds{quantile="0.75"} 0
go_gc_duration_seconds{quantile="1"} 0
go_gc_duration_seconds_sum 0
go_gc_duration_seconds_count 0
# HELP go_goroutines Number of goroutines that currently exist.
# TYPE go_goroutines gauge
go_goroutines 12
# HELP go_info Information about the Go environment.
# TYPE go_info gauge
go_info{version="go1.11.6"} 1
# HELP go_memstats_alloc_bytes Number of bytes allocated and still in use.
# TYPE go_memstats_alloc_bytes gauge
go_memstats_alloc_bytes 1.798512e+06
# HELP go_memstats_alloc_bytes_total Total number of bytes allocated, even if freed.
# TYPE go_memstats_alloc_bytes_total counter
go_memstats_alloc_bytes_total 1.798512e+06
# HELP go_memstats_buck_hash_sys_bytes Number of bytes used by the profiling bucket hash table.
# TYPE go_memstats_buck_hash_sys_bytes gauge
go_memstats_buck_hash_sys_bytes 724468
# HELP go_memstats_frees_total Total number of frees.
# TYPE go_memstats_frees_total counter
go_memstats_frees_total 1026
# HELP go_memstats_gc_cpu_fraction The fraction of this program's available CPU time used by the GC since the program started.
# TYPE go_memstats_gc_cpu_fraction gauge
go_memstats_gc_cpu_fraction 0
# HELP go_memstats_gc_sys_bytes Number of bytes used for garbage collection system metadata.
# TYPE go_memstats_gc_sys_bytes gauge
go_memstats_gc_sys_bytes 334848
# HELP go_memstats_heap_alloc_bytes Number of heap bytes allocated and still in use.
# TYPE go_memstats_heap_alloc_bytes gauge
go_memstats_heap_alloc_bytes 1.798512e+06
# HELP go_memstats_heap_idle_bytes Number of heap bytes waiting to be used.
# TYPE go_memstats_heap_idle_bytes gauge
go_memstats_heap_idle_bytes 589824
# HELP go_memstats_heap_inuse_bytes Number of heap bytes that are in use.
# TYPE go_memstats_heap_inuse_bytes gauge
go_memstats_heap_inuse_bytes 3.11296e+06
# HELP go_memstats_heap_objects Number of allocated objects.
# TYPE go_memstats_heap_objects gauge
go_memstats_heap_objects 6257
# HELP go_memstats_heap_released_bytes Number of heap bytes released to OS.
# TYPE go_memstats_heap_released_bytes gauge
go_memstats_heap_released_bytes 0
# HELP go_memstats_heap_sys_bytes Number of heap bytes obtained from system.
# TYPE go_memstats_heap_sys_bytes gauge
go_memstats_heap_sys_bytes 3.702784e+06
# HELP go_memstats_last_gc_time_seconds Number of seconds since 1970 of last garbage collection.
# TYPE go_memstats_last_gc_time_seconds gauge
go_memstats_last_gc_time_seconds 0
# HELP go_memstats_lookups_total Total number of pointer lookups.
# TYPE go_memstats_lookups_total counter
go_memstats_lookups_total 0
# HELP go_memstats_mallocs_total Total number of mallocs.
# TYPE go_memstats_mallocs_total counter
go_memstats_mallocs_total 7283
# HELP go_memstats_mcache_inuse_bytes Number of bytes in use by mcache structures.
# TYPE go_memstats_mcache_inuse_bytes gauge
go_memstats_mcache_inuse_bytes 3456
# HELP go_memstats_mcache_sys_bytes Number of bytes used for mcache structures obtained from system.
# TYPE go_memstats_mcache_sys_bytes gauge
go_memstats_mcache_sys_bytes 16384
# HELP go_memstats_mspan_inuse_bytes Number of bytes in use by mspan structures.
# TYPE go_memstats_mspan_inuse_bytes gauge
go_memstats_mspan_inuse_bytes 22080
# HELP go_memstats_mspan_sys_bytes Number of bytes used for mspan structures obtained from system.
# TYPE go_memstats_mspan_sys_bytes gauge
go_memstats_mspan_sys_bytes 32768
# HELP go_memstats_next_gc_bytes Number of heap bytes when next garbage collection will take place.
# TYPE go_memstats_next_gc_bytes gauge
go_memstats_next_gc_bytes 4.473924e+06
# HELP go_memstats_other_sys_bytes Number of bytes used for other system allocations.
# TYPE go_memstats_other_sys_bytes gauge
go_memstats_other_sys_bytes 1.315464e+06
# HELP go_memstats_stack_inuse_bytes Number of bytes in use by the stack allocator.
# TYPE go_memstats_stack_inuse_bytes gauge
go_memstats_stack_inuse_bytes 491520
# HELP go_memstats_stack_sys_bytes Number of bytes obtained from system for stack allocator.
# TYPE go_memstats_stack_sys_bytes gauge
go_memstats_stack_sys_bytes 491520
# HELP go_memstats_sys_bytes Number of bytes obtained from system.
# TYPE go_memstats_sys_bytes gauge
go_memstats_sys_bytes 6.618236e+06
# HELP go_threads Number of OS threads created.
# TYPE go_threads gauge
go_threads 9
# HELP process_cpu_seconds_total Total user and system CPU time spent in seconds.
# TYPE process_cpu_seconds_total counter
process_cpu_seconds_total 0.16
# HELP process_max_fds Maximum number of open file descriptors.
# TYPE process_max_fds gauge
process_max_fds 1024
# HELP process_open_fds Number of open file descriptors.
# TYPE process_open_fds gauge
process_open_fds 101
# HELP process_resident_memory_bytes Resident memory size in bytes.
# TYPE process_resident_memory_bytes gauge
process_resident_memory_bytes 1.0858496e+07
# HELP process_start_time_seconds Start time of the process since unix epoch in seconds.
# TYPE process_start_time_seconds gauge
process_start_time_seconds 1.61359321311e+09
# HELP process_virtual_memory_bytes Virtual memory size in bytes.
# TYPE process_virtual_memory_bytes gauge
process_virtual_memory_bytes 8.93046784e+08
# HELP process_virtual_memory_max_bytes Maximum amount of virtual memory available in bytes.
# TYPE process_virtual_memory_max_bytes gauge
process_virtual_memory_max_bytes 1.8446744073709552e+19
Prometheus Exporter Installation
Prerequisites
Install golangand make to build the source code:
$ sudo apt install golang makeDefines your environment variables for Golang:
$ export GOPATH=$HOME/go
$ export GOBIN=$GOPATH/bin
$ export PATH=$PATH:$GOBIN
Download dep package:
go get -u github.com/golang/dep/cmd/depBuild
Clone the git repository and build the sources:
$ go get -u github.com/guivin/dht-prometheus-exporter.git
$ cd $GOPATH/src/guivin/dht-prometheus-exporter
$ git checkout tags/v0.1
$ make all
Deployment
Install the systemdservice unit:
$ sudo cp dht-prometheus-exporter.service /etc/systemd/systemDeploy the configuration file:
$ sudo cp dht-prometheus-exporter.yml /etc
$ sudo chown dht-prometheus-exporter:dht-prometheus-exporter /etc/dht-prometheus-exporter.yml
$ sudo chmod 0640 /etc/dht-prometheus-exporter.yml
Create a dht-prometheus-exportersystem user and group for the exporter. This system user belongs also to the gpio as a secondary group to read gpio pins:
$ sudo useradd --user-group --groups gpio --no-create-home --system --shell /usr/sbin/nologin dht-prometheus-exporterStart the systemdunit:
$ sudo systemctl daemon-reload
$ sudo systemctl start dht-prometheus-exporter
Check the logs of the systemdunit:
$ sudo journalctl -u dht-prometheus-exporter -f
Feb 18 07:14:25 raspberrypi dht-prometheus-exporter[4031]: time="2021-02-18T07:14:25Z" level=info msg="Initializing the DHT22/AM2302 sensor on the host"
Feb 18 07:14:25 raspberrypi dht-prometheus-exporter[4031]: time="2021-02-18T07:14:25Z" level=info msg="Starting http server on TCP/8080 port"
Prometheus
Installation and configuration
Create the prometheussystem user and group:
$ useradd --home-dir /opt/prometheus --user-group --shell /usr/sbin/nologin --system prometheusDownload prometheus binary and adapt following your Raspberry Pi architecture (here we use armv7):
$ cd /tmp
$ wget https://github.com/prometheus/prometheus/releases/download/v2.25.0/prometheus-2.25.0.linux-armv7.tar.gz
$ tar xzf prometheus-2.25.0.linux-armv7.tar.gz
Create the home directory for prometheususer in /opt/prometheus:
$ sudo cp -r prometheus-2.25.0.linux-armv7 /opt/prometheus
$ sudo chown prometheus:prometheus /opt/prometheus
$ sudo chmod 0740 -R /opt/prometheus
Create /var/lib/prometheus directory with good permissions for tsdb(time-series database) storage:
$ sudo mkdir /var/lib/prometheus
$ sudo chown -R prometheus:prometheus /var/lib/prometheus
$ sudo chmod -R 0740 /var/lib/prometheus
Create a symbolic link from the configuration presents in /opt/prometheus to /etc:
sudo ln -s /opt/prometheus/prometheus.yml /etc/prometheus.ymlUpdate the /etc/prometheus.yml and add a new job in scrape_configs block:
- job_name: 'dht-prometheus-exporter'
  static_configs:
    - targets: ['localhost:8080']
Create a systemdunit for prometheus in /etc/systemd/system/prometheus.serviceas follows:
[Service]
Type=simple
User=prometheus
Group=prometheus
ExecReload=/bin/kill -HUP $MAINPID
ExecStart=/opt/prometheus/prometheus \
  --config.file=/etc/prometheus/prometheus.yml \
  --storage.tsdb.path=/var/lib/prometheus \
  --storage.tsdb.retention.time=30d \
  --storage.tsdb.retention.size=0 \
  --web.console.libraries=/opt/prometheus/console_libraries \
  --web.console.templates=/opt/prometheus/consoles \
  --web.listen-address=0.0.0.0:9090 \
  --web.external-url=
SyslogIdentifier=prometheus
Restart=always
[Install]
WantedBy=multi-user.target
Start and enable prometheusservice:
$ sudo systemctl daemon-reload
$ sudo systemctl start prometheus
$ sudo systemctl enable prometheus
Ensure prometheus is ok:
sudo systemctl status prometheus --no-pager
● prometheus.service
   Loaded: loaded (/etc/systemd/system/prometheus.service; enabled; vendor preset: enabled)
   Active: active (running) since Thu 2021-02-18 07:37:18 GMT; 16min ago
 Main PID: 4348 (prometheus)
    Tasks: 9 (limit: 2062)
   CGroup: /system.slice/prometheus.service
           └─4348 /opt/prometheus/prometheus --config.file=/etc/prometheus/prometheus.yml --storage.tsdb.path=/var/lib/prometheus --storage.tsdb.retention.time=30d --storage.tsdb.retention.size=0 --web.console.libraries=/opt/prometheus/console_libraries --web.console.templates=/opt/prometheus/consoles --web.listen-address=0.0.0.0:9090 --web.external-url=
Feb 18 07:37:18 raspberrypi prometheus[4348]: level=info ts=2021-02-18T07:37:18.614Z caller=head.go:682 component=tsdb msg="On-disk memory mappable chunks replay completed" duration=21.667µs
Feb 18 07:37:18 raspberrypi prometheus[4348]: level=info ts=2021-02-18T07:37:18.614Z caller=head.go:688 component=tsdb msg="Replaying WAL, this may take a while"
Feb 18 07:37:18 raspberrypi prometheus[4348]: level=info ts=2021-02-18T07:37:18.630Z caller=head.go:740 component=tsdb msg="WAL segment loaded" segment=0 maxSegment=1
Feb 18 07:37:18 raspberrypi prometheus[4348]: level=info ts=2021-02-18T07:37:18.632Z caller=head.go:740 component=tsdb msg="WAL segment loaded" segment=1 maxSegment=1
Feb 18 07:37:18 raspberrypi prometheus[4348]: level=info ts=2021-02-18T07:37:18.632Z caller=head.go:745 component=tsdb msg="WAL replay completed" checkpoint_replay_duration=372.29µs wal_replay_duration=17.413166ms total_replay_duration=18.029362ms
Feb 18 07:37:18 raspberrypi prometheus[4348]: level=info ts=2021-02-18T07:37:18.651Z caller=main.go:799 fs_type=EXT4_SUPER_MAGIC
Feb 18 07:37:18 raspberrypi prometheus[4348]: level=info ts=2021-02-18T07:37:18.652Z caller=main.go:802 msg="TSDB started"
Feb 18 07:37:18 raspberrypi prometheus[4348]: level=info ts=2021-02-18T07:37:18.652Z caller=main.go:928 msg="Loading configuration file" filename=/etc/prometheus/prometheus.yml
Feb 18 07:37:18 raspberrypi prometheus[4348]: level=info ts=2021-02-18T07:37:18.680Z caller=main.go:959 msg="Completed loading of configuration file" filename=/etc/prometheus/prometheus.yml totalDuration=27.748754ms remote_storage=11.666µs web_handler=3.281µs query_engine=5.104µs scrape=1.784837ms scrape_sd=278.332µs notify=7.552µs notify_sd=26.25µs rules=23.37…
Feb 18 07:37:18 raspberrypi prometheus[4348]: level=info ts=2021-02-18T07:37:18.682Z caller=main.go:751 msg="Server is ready to receive web requests."
Hint: Some lines were ellipsized, use -l to show in full.
Web interface
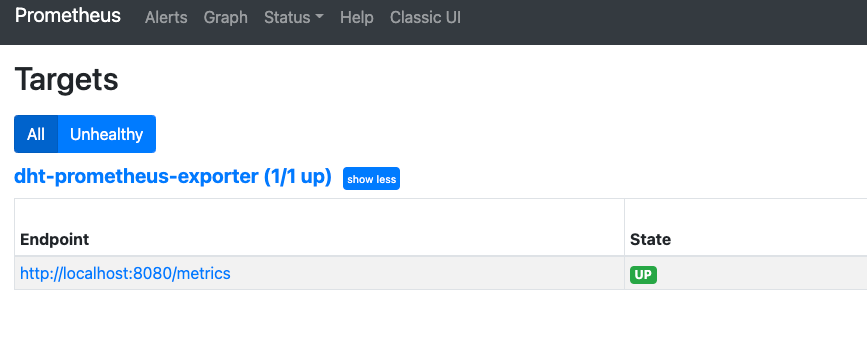
Note your Raspberry Pi private IP using ip acommand. Open your browser and connect to it via TCP/8080 port with HTTP schema (e.g http://<RASPBERRY_IP>:8080). The exporter is well registered in the “Targets” menu:
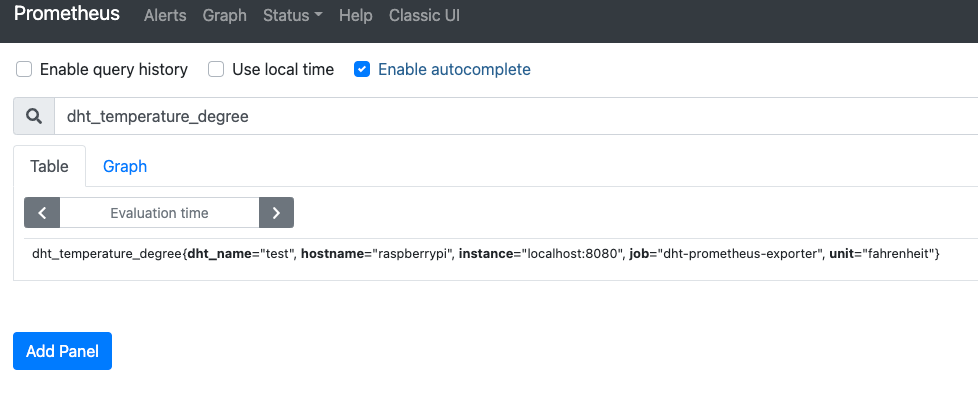
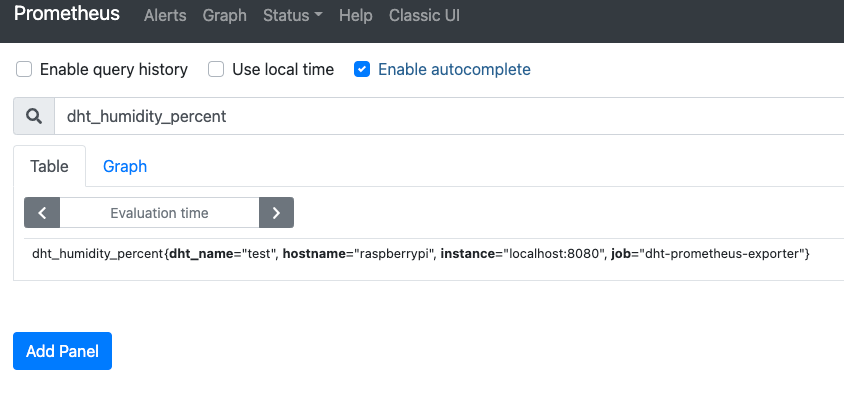
On the homepage of the Prometheus UI, we type the names of both metrics from the exporter. They are present and show their labels we have defined before:
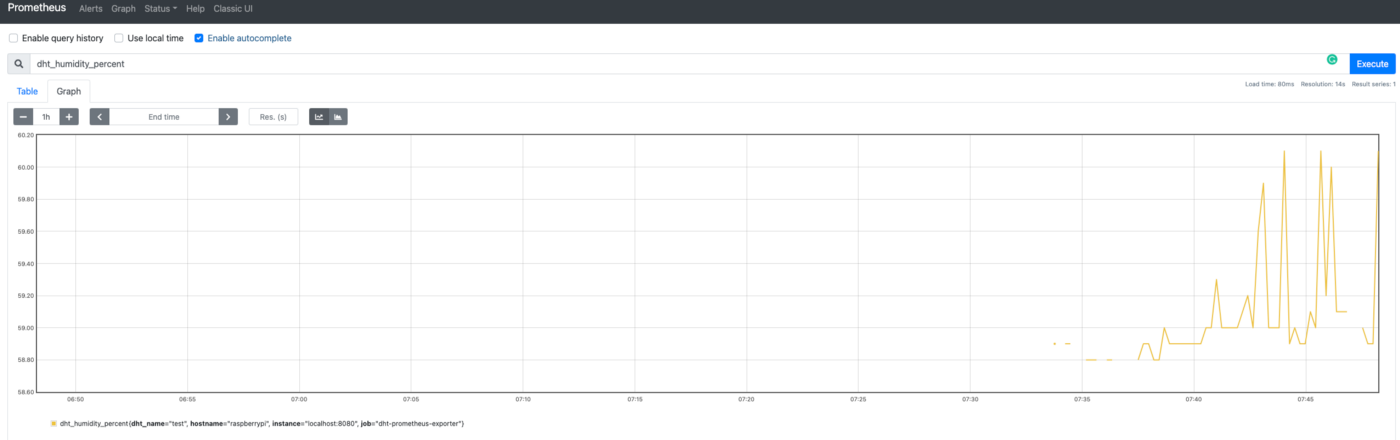
We can also have a graph of the exporter metrics:
Grafana
Installation and configuration
For Grafana you can follow instructions from the link below:

Dashboard creation
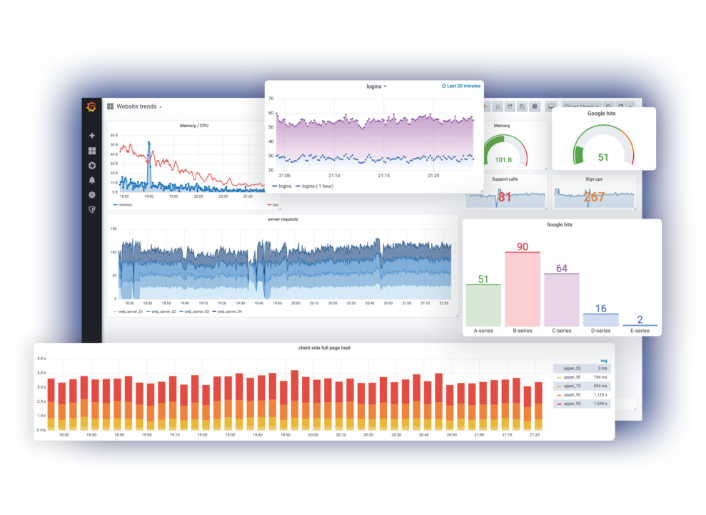
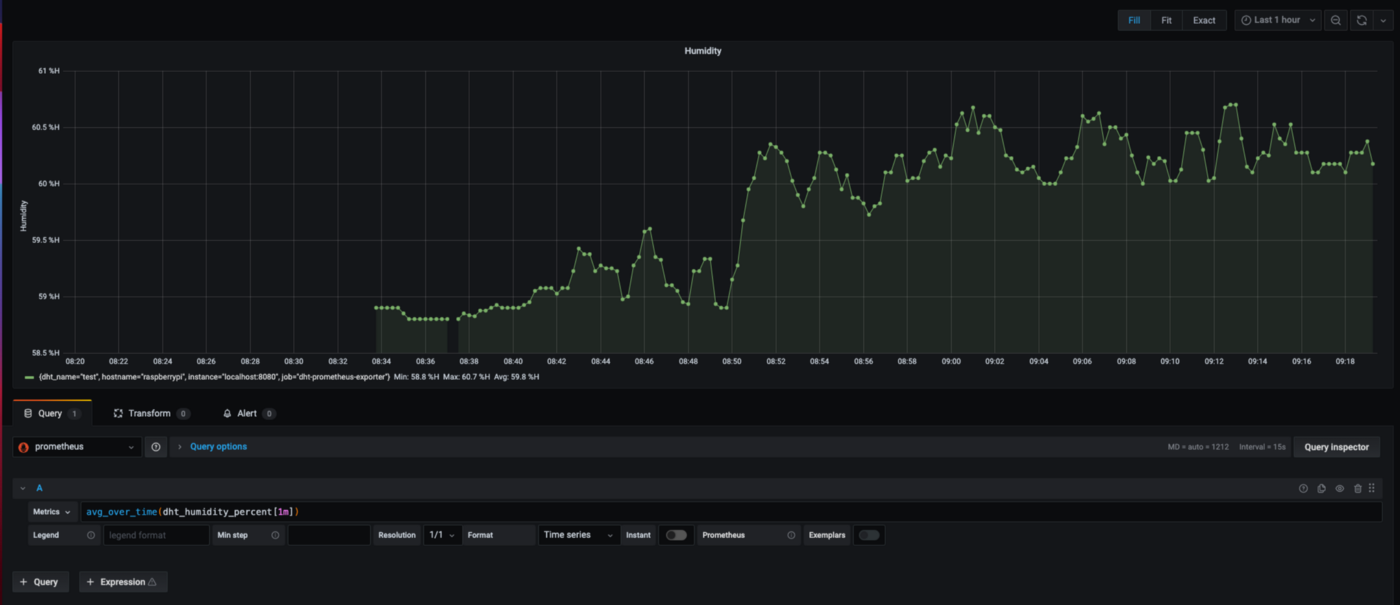
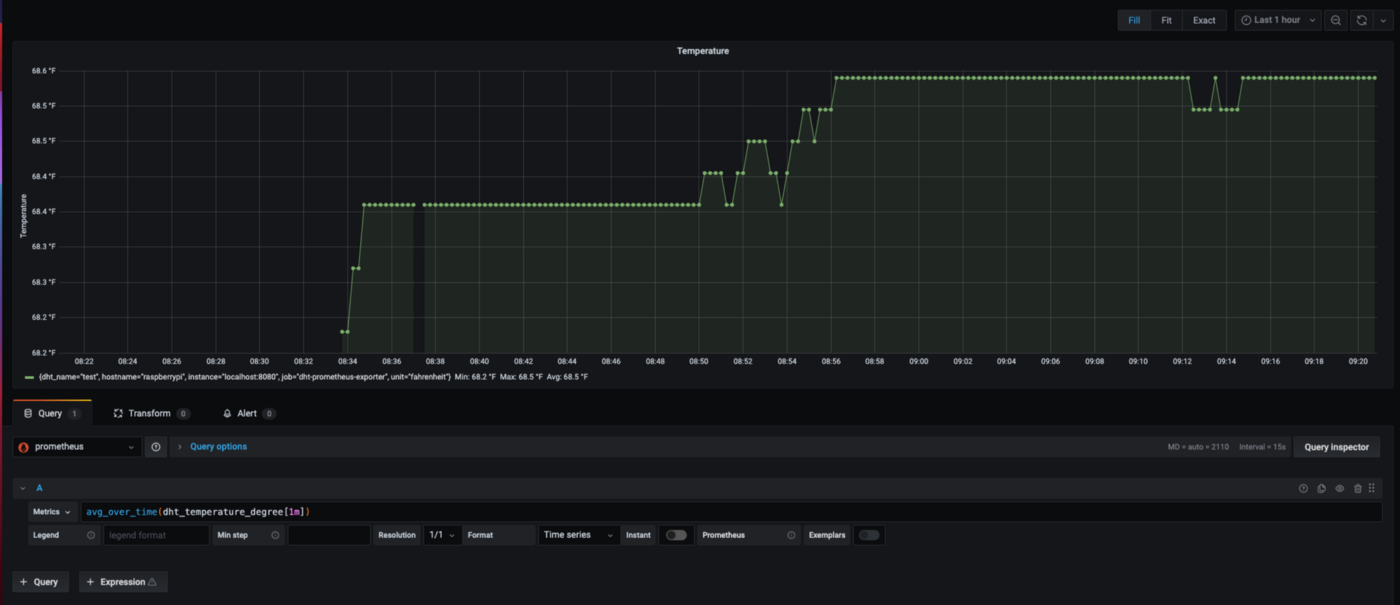
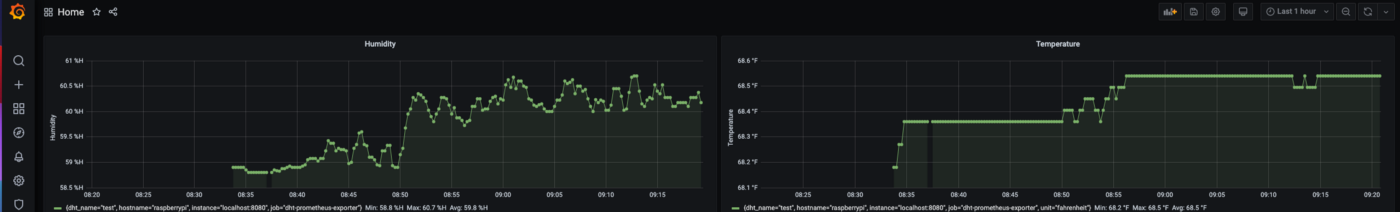
We connect to the Grafana interface and create a new dashboard. In this dashboard, we add a graph for each metric: temperature and humidity. For both, we use the avg_over_time function with a vector of 1 minute. This is to avoid discontinued graphs:
Conclusion
Through these different steps, we have set up a monitoring system with a sensor. We’ve wired the sensor card to the Raspberry Pi and validated the data acquisition. We were able to get the temperature and the humidity of a room.
To give access to these metrics to Prometheus, we have coded an exporter. It exposes the metrics via an HTTP server on request. We’ve also added some labels to our metrics. This is useful in case you want to track many sensors and identify them.
Then, we’ve installed and configured Prometheus on the Raspberry Pi. It scrapes the exporter and stores the metrics. On the Prometheus user interface, we’ve noticed we can query and exploit the metrics.
Using the Prometheus user interface we were able to create graphs from the metrics. But for further, we install Grafana to give a better visualization experience. In Grafana we’ve created a dashboard with humidity and temperature graphs.
This project offers an end-to-end view of what is possible with a Raspberry Pi and Prometheus. I hope it gave you inspiration for your next ideas for home automation projects. Thank you for reading and looking forward to seeing your future achievements!
Resources

 Prometheus


 prometheusMichaelS11